Project 4: Business Intelligence & Data Visualization
Building an Airbnb Analytics Dashboard & Data Model for Business Decision-Making
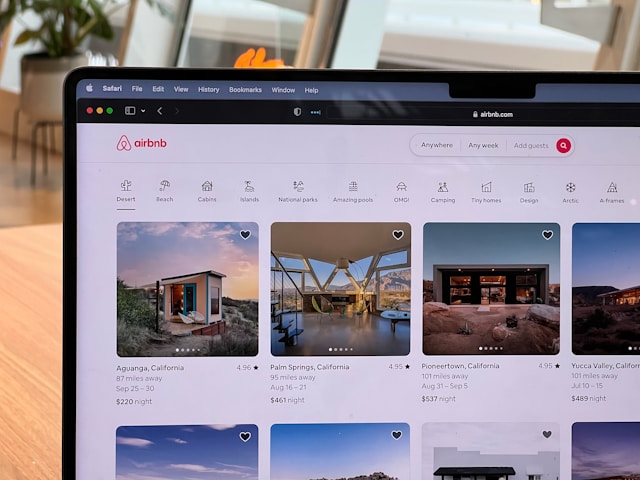
The Problem/Opportunity:
A company considering the acquisition of Airbnb required a complete analytical solution that would allow stakeholders to better understand the platform’s operational performance, pricing behavior, booking activity, and customer engagement.
To support strategic decision-making, the organization needed:
- Clean and reliable datasets
- A structured analytical data model/li>
- Interactive dashboards and reports
- Clear business insights accessible to non-technical stakeholders
The project focused not only on dashboard development, but also on the full preparation of the analytical environment, including:
- Data loading and validation
- Data cleaning and transformation
- Data modeling using Fact & Dimension tables
- Relationship management
- Cross-validation and data reliability checks
- Interactive dashboard creation and storytelling
The dashboard was designed to answer key business questions such as:
- Which hosts and listings perform the best?
- Which locations show the highest demand?
- What are the average rental prices and booking trends over time?
- Which opportunities or operational risks can be identified from the data?
- How do reviews, bookings, pricing, and host activity evolve over time?
A major focus was placed on usability and storytelling so that stakeholders could quickly understand the business performance and make informed decisions.
The key stakeholders include:
- Executive stakeholders and decision-makers
- Strategy and operations teams
- Pricing and performance teams
- Data analysts and BI teams
Key Insights:
Data Loading & Initial Exploration
- Loaded Airbnb datasets from CSV files and Data Warehouse tables into Power BI
- Imported data related to::
- Listings
- Hosts
- Reviews
- Bookings
- Opened and managed transformations through Power Query
- Explored datasets to identify:
- Missing values
- Incorrect data types
- Formatting inconsistencies
- Outliers and data quality issues
- Validated all data types using the provided data dictionary
- Examples included:
- Numbers → Whole/Decimal
- Dates → Date
- Text fields → Text
- Additional preparation tasks included:
- Converting neighborhood names to proper Greek text format
- Renaming columns into business-friendly naming conventions
- Applying standardized prefixes such as:
- listing_*
- host_*
- review_*
- booking_*
- This improved readability, maintainability, and model clarity.
Data Cleaning & Transformation
Performed extensive cleaning and transformation processes in Power Query to ensure data reliability and analytical usability.
Missing Value Handling
- Numerical Fields
- Avoided replacing missing prices or quantities with zero where it would distort business meaning
- Used null handling or average-based imputation where appropriate
- Text Fields
- Standardized missing text values using:
- “Unknown”
- “N/A”
- Date Fields
- Applied placeholder dates where necessary for consistency
- Cleaned columns containing symbols or formatting inconsistencies, such as:
- Currency symbols ($)
- Percentages (%)
- Text-based numeric values
- Converted them into proper numeric formats for analytics and KPI calculations.
- Split host_location into:
- City
- Country
- Standardized inconsistent location naming conventions:
- Athens
- Αθήνα
- Athina
- Used:
- Replace Values
- Column Quality
- Column Distribution
- Column Profile
- Converted bathrooms_text into numeric values
- Example:
- “1 bath” → 1
- “1.5 baths” → 1.5
- Renamed the field to bathrooms
- Removed redundant columns
- Applied business validation to:
- minimum_nights
- maximum_nights
- Restricted unrealistic values above 365 days
- Minimum Potential Profit
- Maximum Potential Profit
- Price × Minimum Nights
- Price × Maximum Nights
- Merged booking-related availability data into review tables using Power Query Merge operations
- Used listing_id as the joining key
- Applied additional validations for booking duration fields
- Yes/No
- True/False
- 1/0
- Data model efficiency
- KPI calculations
- Compression and performance within Power BI
- Duplicated the listing table in Power Query
- Kept only:
- listing_id
- amenities
- Split amenity values into separate rows using delimiter-based normalization
- Expanded amenities into one row per listing/amenity combination
- Removed quotes and brackets
- Applied trimming
- Standardized formatting for consistency
- Listings with WiFi
- Most common amenities
- Premium property feature analysis
- Included:
- Year
- Month
- Quarter
- Day
- Month Name
- The calendar table enabled:
- Monthly booking analysis
- Seasonal trend analysis
- Time-based DAX calculations
- Year-over-year comparisons
- Defining Primary/Key columns
- Creating relationships between entities
- Validating:
- Cardinality
- Cross-filter direction
- Configuring data categories:
- URLs
- Geographic fields
- Formatting measures and attributes appropriately
- Adjusting summarization behavior for analytical accuracy
- Multiple date fields
- Calendar relationships
- Different business contexts for dates
- Host registration dates
- Booking dates
- Raw CSV/Excel data
- Power BI model outputs
- Record counts
- Sums
- Averages
- Min/Max values
- COUNT
- SUM
- AVERAGE
- MIN/MAX
- Identifying transformation errors
- Detecting incorrect null handling
- Validating merges and filters
- Ensuring raw data fidelity
- High-resolution report pages (1920×1080)
- Airbnb-inspired color palette
- Consistent typography and spacing
- KPI cards positioned at the top of each page
- Interactive slicers for:
- Area
- Room Type
- Price
- Host
- Slicer synchronization across report pages
- Conditional formatting and layout optimization
- Visual interaction management to avoid unnecessary cross-filtering issues
- Price category segmentation
- Quality/rating categories
- Total listings
- Total bookings
- Total reviews
- Average rental price
- Average stay duration
- Adjusted price trends
- Year-over-year price comparisons
- Host contribution metrics
- Total listings
- Total hosts
- Total bookings
- Total reviews
- Average rental price
- High-level trends and KPIs
- Top 10 hosts by listings
- Top 10 hosts by review scores
- Host contribution to the platform
- Host engagement and pricing behavior
- Room/property types
- Average rental prices
- Geographic distribution
- Review performance
- Property popularity and pricing relationships
- Booking trends by month/year/quarter
- Average stay duration
- Seasonal demand
- Adjusted pricing trends
- Booking performance by location and host
- High-demand locations and booking periods
- Top-performing hosts and premium properties
- Pricing behavior across property categories
- Relationships between review scores and pricing
- Seasonal booking trends
- Amenity-driven property performance
- Opportunities for pricing optimization and business growth
- Data preparation
- Data cleaning
- Transformation
- Data modeling
- Validation
- Dashboard development
- Business storytelling
- Transformed raw Airbnb data into a reliable analytical model
- Applied Data Warehousing and Business Intelligence principles
- Delivered interactive dashboards for business stakeholders
- Improved data quality and reporting reliability
- Enabled strategic business analysis through KPIs and trends
- Created scalable foundations for future reporting and analytics initiatives
- Power BI
- Power Query
- DAX
- Data Cleaning & Transformation
- Data Modeling
- Fact & Dimension Architecture
- Cross Validation
- Business Intelligence
- Dashboard Development
- Data Visualization & Storytelling
- KPI Development
- Analytical Thinking
- Microsoft Power BI
- Power Query
- DAX
- Data Modeling
- Data Cleaning & Transformation/li>
- Business Intelligence Reporting
- Interactive Dashboards
- SQL-based Data Sources
- Excel (Cross Validation)
- Fact & Dimension Modeling
- Time Intelligence Analysis
Formatting & Type Transformations
Advanced Power Query Transformations
Host Data Transformation (DimHost)
to identify and correct data inconsistencies and transformation errors.
Listing Information Transformation (DimListingInfo)
Performed multiple business-focused transformations, including:
Created calculated business metrics:
using:
FactReviews & FactBookings Enhancements
Binary Field Optimization
Converted:
fields into:
This improved:
DimListingAmenities Creation
Built a dedicated amenities dimension table for granular amenity analysis.
Transformation Process
Performed additional cleaning:
This enabled advanced amenity-based analysis such as:
Calendar Table Development
Created a dedicated Calendar table to support time intelligence and trend analysis.
Data Modeling & Relationships
Built a structured Power BI data model using Fact and Dimension tables.
Model Enhancements Included:
Resolved modeling challenges related to:
Cross Validation & Data Reliability
Performed extensive cross-validation between:
Validation checks included:
Used Excel formulas such as:
Compared results against Power BI visuals and measures to verify consistency and reliability.
Additional validation included:
This process ensured the final analytical model was trustworthy and suitable for reporting and dashboard creation.
Dashboard Design & User Experience
Designed the report using a clean, executive-friendly layout focused on storytelling and usability.
Key Design Elements
DAX Calculations & Business Metrics
Created multiple DAX calculated columns and measures.
Calculated Columns
Examples included:
Measures
Developed analytical KPIs such as:
Report Pages & Analysis
1. Overview Dashboard
Created an executive summary page displaying:
Focused on providing a fast and intuitive business overview.
2. Host Analysis
Analyzed:
Designed the page to resemble a “host profile” experience.
3. Property Analysis
Analyzed:
Included interactive maps and property-focused visuals.
4. Booking Analysis
Analyzed:
Included detailed booking tables for operational analysis.
Business Insights & Findings
The dashboard enabled the identification of multiple strategic insights, including:
The Outcome:
This project resulted in a fully interactive and business-ready Power BI analytical solution combining:
The final solution successfully:
The project demonstrates practical experience in:
Overall, this project showcases the ability to build an end-to-end Business Intelligence solution similar to what a professional Data Analyst or BI Developer would create in a real business environment.